There was a lot of discussion of the jobs recovery during the election campaign. In fact ‘Jobs’ was consistently ranked No. 2 in Google searches related to the Irish election this year (just behind Taxes). And much of the discussion was about where those jobs were being created.
The results of this year’s Census will give a great opportunity to really interrogate the spatial patterns of Ireland’s recent jobs performance and what has happened since 2011, especially to consider how any recovery has benefitted rural areas, villages, small towns, disadvantaged urban areas etc. However those results will not be available until 2017 so in the meantime we need to rely on survey based data, which is limited in its availability at regional or county level.
The labour market is extremely complex and it’s difficult to fully capture that complexity, especially at smaller spatial scales where a single employer or event can have a major impact. In this blog post therefore I’ve taken a very broad look at regional job trends to try to provide a snapshot of what’s happening. The latest available regional employment data was published last week (CSO, Quarterly National Household Survey, Quarter 4 2015) and is used here.
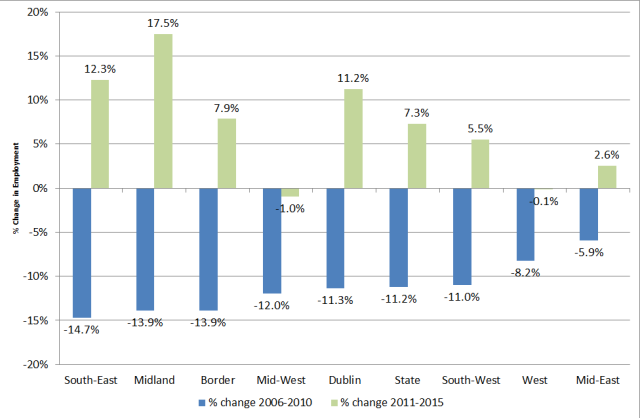
Percentage change in employment 2006-2010 and 2011-2015
Fig. 1 shows the percentage change in the number of people at work in each of the NUTS3 regions. It compares two five-year periods, the crisis (Q4 2006 – Q4 2010) and the recovery (Q4 2011 – Q4 2015). As we know, during the crisis the South East, Midlands and Border were particularly hard hit by job losses. This included people who were commuting from these regions into Dublin, many of whom had bought houses at the edges of the ever expanding Dublin commuter belt. Intimately linked to this, these regions also had a high reliance on the construction sector.
It was the Mid-East and West which had the smallest employment declines, the strength of Galway and its medical devices cluster is known to have contributed to this in the West. However, one of the most noticeable patterns in Fig. 1 is that the Mid-West and West do not seem to be benefitting from the jobs recovery, having employment decline in both periods. For a number of other regions, the growth they have experienced between 2011 and 2015 is less than their previous percentage decline. This is the case for the Border, South-East, South-West and Mid-East. Only the Midlands has experienced stronger jobs growth than its earlier decline.

Fig. 1: Percentage change in employment by NUTS3 region, Q4 2006 – Q4 2010 and Q4 2011 – Q4 2015. Source: CSO, Quarterly National Household Survey, Q4 2015
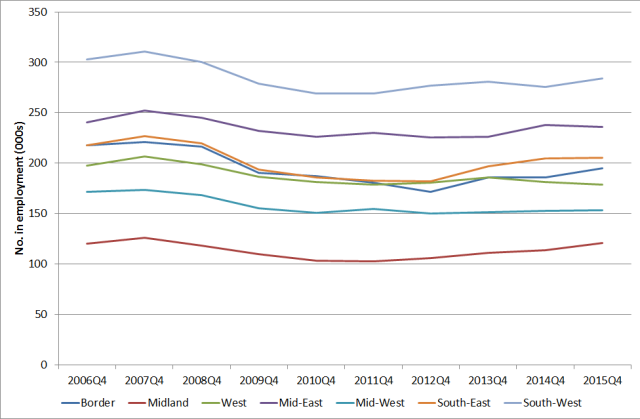
Regional employment trends 2006-2015
Fig. 2 shows the number of people in employment in each of the NUTS3 regions except Dublin (which is excluded due to scale) from 2006 to 2015. The South West, with 284,000 has the highest employment of the regions shown. The South-West shows a clear pattern of decline followed by gradual recovery, but in 2015 remains below its 2007 peak. The South-East, Border and Midlands follow a similar pattern as does the Mid-East though it did have a slight decline in 2015. The only region to regain its 2007 level of employment is the Midlands.
Again, the West and Mid-West stand out as having a different experience. While they had a similar decline from 2007, their employment trends do not show any real signs of recovery. For the Mid-West, employment has remained almost unchanged since 2012, while in the West it has declined notably since 2013.

Fig. 1: Employment by NUTS3 region (excluding Dublin), Q4 2006 – Q4 2015. Source: CSO, Quarterly National Household Survey, Q4 2015
The reasons for the weak performance of the West and Mid-West would need to be further explored. In their 2015 end of year statement, Enterprise Ireland reported that the North-West, Mid-West and West had the lowest jobs growth in companies assisted by the agency, while the poor performance of the North-West region in total agency assisted employment since 2005 has been discussed in a previous blog. The Western Region clearly faces some very serious challenges in its ability to fully benefit from the national jobs recovery.
Others have also been examining the uneven regional distribution of jobs growth, such as PublicPolicy.ie. It is a topic that will clearly must be a priority for the next Programme for Government and central to the development of the new National Planning Framework, which will have to be taken up by the new Government and Minister.
Pauline White

Another interesting read. Thank you. Is there any way of knowing how many of those additional jobs in the latter period where taken up by people who lost their jobs in the earlier period? Were they jobs in new companies or the same companies restoring old jobs? Were they unemployed people finding new work or a different cohort of people entering the work place? I guess this would vary very much from region to region but it would be interesting research for someone. maybe you know where such work is being done? Judy Osborne. Spatial Planner.
LikeLike
Thanks for your comment. Really interesting questions. Unfortunately there’s no easy answer and the increasing job numbers are likely due to a mix of all these elements. In fact we will shortly be publishing a WDC Insights on labour market patterns in the Western Region which clearly shows that self-employment was a major factor in increasing employment in the region in the past few years, and more so than in the rest of the state.
Micro-data is available from the QNHS on what are called labour market transitions. This measures three types of transitions: between employment and unemployment; between employment and inactivity (retirement, education, home duties); and between unemployment and inactivity. So for example it would show people moving from being unemployed or inactive (e.g. students) into a job. According to the Regional Labour Markets Bulletin 2015 (http://www.skillsireland.ie/Publications/2015/Regional_Labour_Markets_Bulletin_2015_ONLINE_PUBLICATION_SkillsIrelandIM.pdf), produced by Solas for the Expert Group on Future Skills Needs, during 2014 at the national level, there were almost 40,000 more transitions from unemployment into employment than the other way around, showing that some of the jobs growth at least is being filled by people who were previously unemployed. In the same year there were 11,000 more transitions from inactivity into employment than in the opposite direction, which shows that jobs growth was also being filled by new entrants or people returning to the labour market and that this outnumbered the people exiting the labour market (mainly into retirement).
At the regional level, Dublin had the most vibrant labour market – it was estimated that in 2014 those who entered employment outnumbered those that became unemployed by the ratio of 4.5:1; in contrast, the South-East and West regions had the lowest ratio of 2.4:1.
The CSO also produces Job Churn data (http://www.cso.ie/px/pxeirestat/database/eirestat/Job%20Churn/Job%20Churn_statbank.asp?sp=Job) which looks at those flows in the labour market, this data has only become available in the last number of years and is not produced at a regional level however. There has been statistical research on labour market transitions (http://www.esri.ie/publications/developments-in-the-irish-labour-market-during-the-crisis-what-lessons-for-policy/) during the crisis as well, but again this looked at the national picture.
There may be others examining these flows at a detailed regional level. The internal dynamics of regional labour markets are fundamental to planning for development in the regions, however there are some real data constraints to getting a complete picture of what’s happening.
Pauline White
LikeLike